NASA satellites have been monitoring the impact of El Niños over the past 15 years.
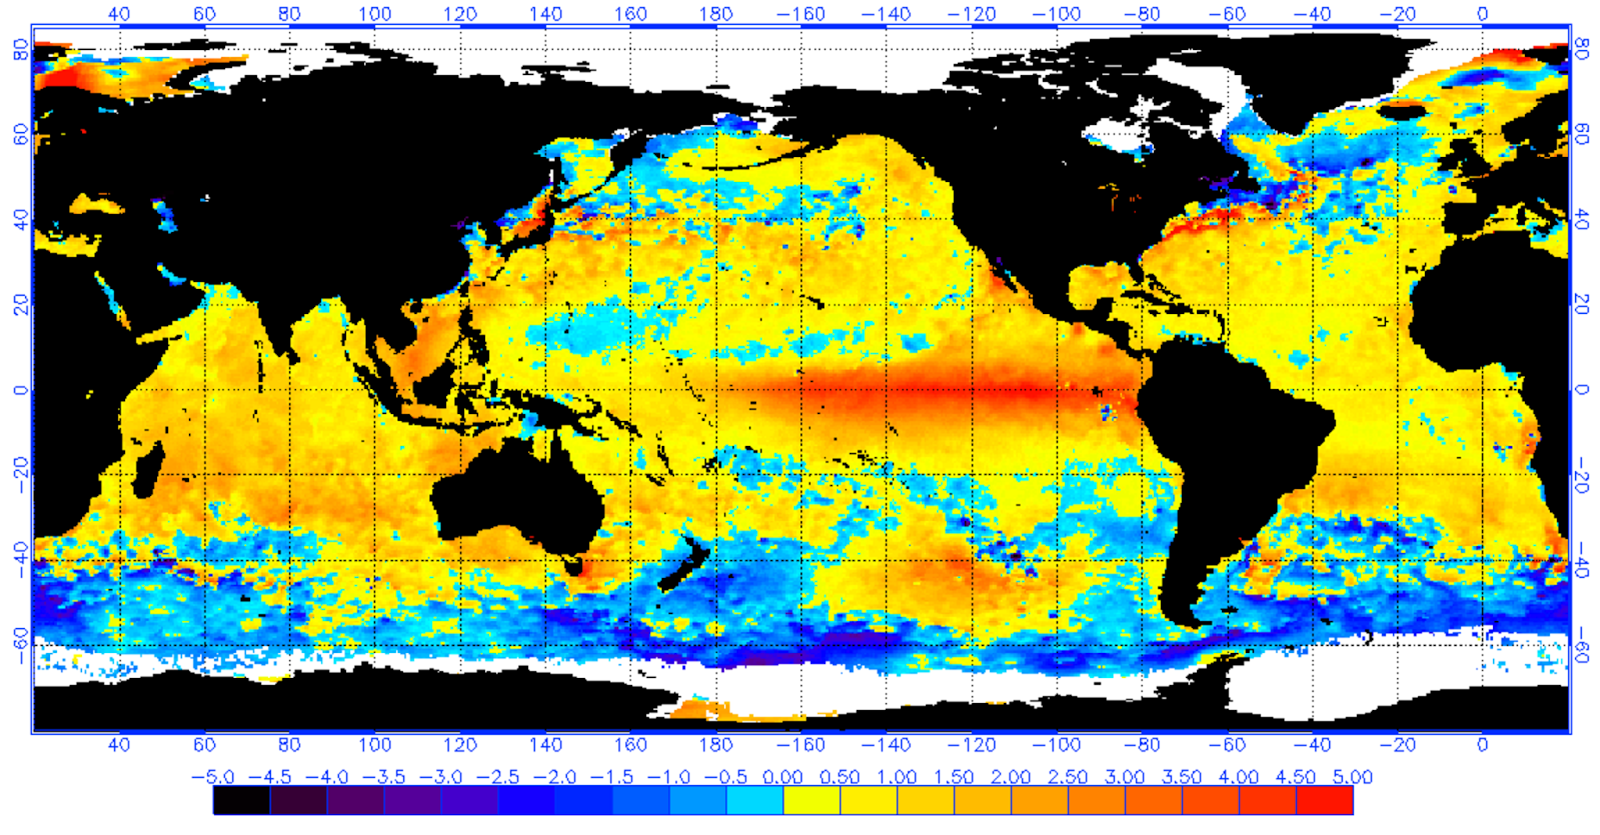 |
| Deviation from mean surface water temperatures 17 December 2016 source: NOAA |
El Niños occur when equatorial Pacific Ocean temperatures warm up over a prolonged period of time. NOAA defines this period as a 3-month increase in the mean surface water temperature of 0.9 °F (0.5 °C) or more in the east-central tropical Pacific.
Increased surface water temperatures feed heat and moisture transport into the atmosphere by intensifying convection. Convection occurs as heat from the ocean warms the air as it flows over the ocean surface. The warmer air expands, becomes less dense, and rises. This process creates a conduit of heat and moisture that fuels storms.
Contrasting higher than mean temperature deviations in an El Niño event, a La Niña event is characterized by a lower than mean temperature deviations.
"Big whirls have little whirls,
That feed on their velocity;
And little whirls have lesser whirls,
And so on to viscosity."
― Lewis Fry Richardson
 |
| Storm swell attributed to 2002-03 El Niño Ocean Beach, San Diego source: PD Photo.org |
REFERENCES
- El Niño, Wikipedia.
- El Niño Portal, NOAA.
- NASA Examines Global Impacts of the 2015 El Niño, NASA, 15 December 2015.
- Understanding El Niño, by Johan Bromwich, New York Times, 16 December 2015.


